Certainty and Belief
It is helpful to click on the image on the right to open it, and then read the article below.


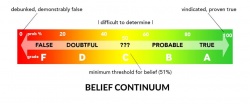
The next time you're in a serious discussion and someone asks how how you know you're right, skip the long winded explanation and simply say that you don't know. Then get out this graph (at least mentally) and ask them to put an "x" where the proposition that you're debating falls on the scale for them. Then put an "x" where it falls for you.
Next, ask them to explain HOW the proposition ended up where it did for them. And then, you do the same. The point is to force people to do a little bit of critical thinking without being a jerk.
We call this a "Belief Scale", "Belief Continuum" or "Certainty Spectrum". We all have one whether we realize it or not.
Here are a few points of interest:
- God doesn't have beliefs, only knowledge. He doesn’t need beliefs because–unlike you and I–he DOES know. He is omniscient (complete information) and is the 'logos' (perfect reasoning). Therefore, to God the truthfulness of all propositions is binary: either true–or false.
- We have incomplete information and imperfect reasoning. And yet we often treat our conclusions as if they are as binary as God's omniscient knowledge, either absolutely true or obviously false.
- Although we really don't think about these things in mathematical terms, anything falling from (51% - 100%) on your scale is a BELIEF that you currently hold (more likely true than not). Anything left of that is not a belief that you hold.
- If every truth proposition that you've ever been faced with were represented by a dot on this scale, what would it look like? My hypothesis is that people who do good research and apply solid reasoning would have a greater dispersion of dots across the entire range while poor thinkers would tend to have more polarity (dots concentrated at the ends of the scale). In addition, I believe that humble, careful thinkers will tend to have more displacement in their graphs, that is, over time their beliefs (dots) would have shifted positions up or down the graph compared to people who are not.
Footnotes